Words: 4,967 Time: 20 Minutes
- S&P finishes 2024 with a 23% gain
- 2025 will be more about stock selection (vs the Index and Mag7)
- Criteria which qualifies as a high quality investment
“The best business to own is one that over an extended period can employ large amounts of incremental capital at very high rates of return. The worst business to own is one that must, or will, do the opposite – that is, consistently employ ever-greater amounts of capital at very low rates of return”
— Warren Buffett
We will come back to our life mentor soon…
But first, the 2024 trading year is behind us.
The S&P 500 recorded a 23.3% gain – and the first time since 1998 – posted two consecutive years of gains above 20%.
Not bad right?
Well if we extend our time horizon to include 2022 – the market’s CAGR is just 7.2% (below its long-term average of ~8.0% exc dividends)
Mmm. Not as good.
And over 5 years – the S&P 500 CAGR is is 12.7%; and over 10 years its 12.4%
Better.
Two important points to make:
- Avoid cherry picking dates. It’s easy to make any statistic fit a narrative; and
- Anything less than 5 years is a very short period to measure success (or failure)
Now a lot of people have written in a told me they made “20% this year”... which is great news! Congrats!!
My first question is what is your return over the past 5 years? And 10 years?
If you can do 20% on average for 10 years – it’s less likely luck. It indicates you are doing something right (through up and down cycles).
Now rarely will you hear 20% over 10 years.
Unless of course your name is Warren E. Buffett… where the Oracle has averaged ~20% CAGR for 57 years.
Moving along – over the past six weeks or so – analysts are busy providing their 2025 EOY forecasts.
You might recall this post – Here Come the Foolish Forecasts – where I said expect analysts to forecast a gain of around 8.0% (or in the realm of up to 6,600)
So why 8% (and not say 5% or 12%)?
Simple:
The 100-year average annual capital gain for the S&P 500 is ~8.0% (which is exclusive of avg ~2.5% dividends)
And in the absence of some impending recession or financial calamity – that’s where group-think will cluster.
Now according to Morningstar – the median target from Wall Street is…
Drum roll please….
What do you know the median target is 6,600!
Well I’ll be damned…
Below are institutions and research houses targets (along with the expected gains for the year ahead):
| Company | 2025 F’Cast | Expected Growth |
|---|---|---|
| Oppenheimer Asset Management | 7100 | 22.2% |
| Yardeni Research | 7000 | 17.0% |
| Deutsche Bank | 7000 | 17.0% |
| Société Générale | 6750 | 13.9% |
| BMO Capital Markets | 6700 | 13.3% |
| Wells Fargo Investment Institute | 6600 | 12.0% |
| Barclays | 6600 | 12.0% |
| RBC Capital Markets | 6600 | 12.0% |
| CFRA Research | 6585 | 11.8% |
| Citi | 6500 | 10.6% |
| Goldman Sachs | 6500 | 10.6% |
| Morgan Stanley | 6500 | 10.6% |
| JPMorgan | 6500 | 10.6% |
| UBS | 6400 | 9.2% |
| MEDIAN | 6600 | 12.0% |
Analysts made the same mistake last year – clustered around a number.
Most got it terribly wrong.
For what it’s worth – Ed Yardeni takes home the chocolates for 2024 – with this estimate of 5400 – only 9.0% out.
Well done Ed… 9% out is a good result.
However, the fat Rasberry goes to…. drum roll…. BCA Research… who told us we would finish the year at 3300!
Great effort – you were only 78% out with your EOY 2024 forecast.
What grade does that deserve?
If I was wrong by 78%…. I doubt anyone would read my blog! But I’m assuming people actually pay good money for those (expert) forecasts?
J.P. Morgan said we would finish 2024 at 4200 – just 40% out. Room for improvement?
Let’s circle back next year.
Quality at Reasonable Prices – Key to 2025
So that’s the folly of forecasting.
If someone offers you a forecast for next year… just quietly nod… and walk slowly backward (no sudden movements)
You could find better value watching social media (does anyone still use it?)
Now if you look at the 23% return from the Index – it pays to look under the hood.
Just seven stocks comprised ~54% of all the market’s gains (and around 35% of the total market capitalization)
The other 493 stocks comprised the balance.
2024 was a story of multiple expansion (i.e., call it FOMO… willing to pay any price for the promise of growth).
Yes, we will likely see earnings growth to the tune of 11-12% (which is good) – but that growth come from a handful of stocks.
Irrespective, 11-12% earnings growth doesn’t constitute 4+ multiple turns higher in valuation!
From my lens – this matters.
For example, if we don’t see stellar earnings growth next year (e.g., something closer to 15% YoY) – it will get harder to juice the multiples (especially in the face of rising bond yields)
You tell me – is Apple worth 32x its forward earnings with low single digit revenue?
Plenty of people will obviously say yes.
I can give you lots of reasons why I justify a mutliple in the low 20s (which I will explain more below)… but zero reasons to justify 32x
Given the multiples being asked of certain popular stocks (specifically the Mag 7) – I will be looking at other sectors (e.g. health, industrials and materials) for two things:
- Is the asking price close to (or ideally) below its intrinsic value; and
- Does it exhibit the necessary qualities I look for in a business?
Print this out and stick it above your desk (next time you are thinking of buying something)
These are two very separate exercises.
Both need to be done.
For example, most large cap tech (excluding Tesla) handily satisfy the quality criteria.
They are outstanding businesses in terms of their growth rates (less so Apple), strong free cash yields, balance sheet, competitive moats (reflected by their profit margins), return on assets and return on equity.
And it’s most why investors flock to them… the quality is on full display.
If you tune into the talking heads — it’s the Mag 7 Thunderdome — “you just have to be in these names”
Rarely can we go a single day without hearing at least one of these names.
Question: why do I have to be in Apple at 32x forward?
I made the tough decision the other week to say farewell the very last portion of my Apple shares at $254.
We will see in the next few months if that was a good decision… but I can’t get myself to believe they are 32x forward earnings (the growth simply isn’t there).
Where most large-cap tech fails (with the exception of Google at ~22x forward) is the value you are getting.
I attempted to demonstrate this with Nvidia using a discounted cash flow analysis.
For example, if we project forward 5 years assuming:
- 40% revenue growth (vs the 55% expected next year);
- 35% net income margins (vs near 40% of the past 4 years)
- 10% discount factor (my expected rate of return for owning the asset); and
- Perpetual 3% growth rate (calculating the terminal value)
I came up with an intrinsic value of around $85 per share (vs the $137 asking price today)
Therefore this qualifies me out.
For clarity – it doesn’t mean you have to wait to buy at the intrinsic price. That’s not the intent.
The intent is to dimension the potential risk you are taking.
Put it this way – investors should always be first looking down – not up.
Too many only look up (e.g., they see revenue growth and net income margins to “the moon” and think that’s all that matters)
That’s lazy analysis (not to mention a dangerous assumption).
Now in the spirit of always looking down (e.g., being careful to dimension our risks) – today’s New Year’s Eve post looks at the second part of the equation.
What are the quality aspects we should consider?
Here I will draw from the work of Warren Buffett (using examples for his current holdings); and the book “Invest Like a Guru” by Charlie Tian
Tian offers us some extremely useful historical data points and key financial ratios – which will help us filter the wheat from the chaff.
In other words, we can tilt the odds of success to our favour by only buying quality.
What’s A High Quality Company?
Before I begin…
One of my investing and (life) philosophies is this:
It’s better to be approximately right than precisely wrong.
We don’t know the future. All we have are probabilities.
Therefore, when attempting to predict the future (which is the game of investing) – we’re just trying to be in the ballpark.
If we happen to be precisely right – well that’s just luck. A lot of things went our way.
However, if we are precisely wrong… that can be painful.
Therefore, we want to increase our probabilities of being approximately right with every bet (investment) we make.
And we can do that by focusing exclusively on high quality companies at reasonable prices.
Okay – still with me?
If you are – great – make a strong cup of coffee and settle in – as we’re going to cover a lot of ground.
What follows is a good 30-mins of reading… but I will make it worth your time. Heck – you might even make some money from it!
So let’s by defining what makes a good investment:
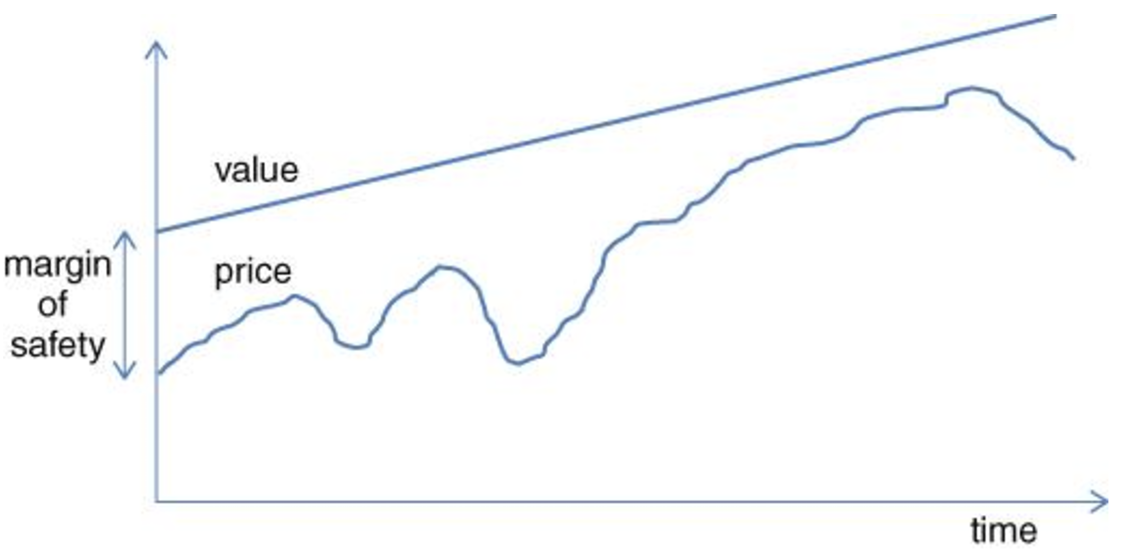
A good company is one that can continuously grow value through its operations.
And if you’re investing in a good business – it will be worth more tomorrow than it is today.
On the other hand, a poor business is one which consumes greater amounts of capital and very low rates of return erode value over time (coming back to my opening quote from Buffett)
From an Intelligent Investor’s lens (which is you) – it looks like this:
Source: “Invest Like a Guru”
That sounds simple enough…
But how do you know if you’re investing in a quality business – with a sufficient margin of safety?
In short, it takes work.
And that work is dedicating (focused) time reading through historical financial statements over 5 to 10 years.
A quick side story:
I was telling a friend recently that some “investors” spend more time agonizing over buying a $200 per of jeans than they would investing $10,000 into a stock.
They probably research all the sites they can get the jeans… perhaps try on various sizes… they want to get it just right and know they got a great deal.
But that same person reads some random report on SeekingAlpha or a talking head on CNBC and says “Buy Crowdstrike because its growing revenue at 30%” or buy “AI Boom Co. as its going to turn profitable and leverages AI”… and boom… decision made.
Anyone nodding in agreement who knows someone like that?
Bonkers.
The good news is any number of websites (some are free; others are paid) have “spreadsheeted” (if that’s a word) much of this data for you!
For example, Charlie Tian’s “Gurfocus” does that for a price of around US $500 per year (and there are many others; e.g. Finbox etc – loads of them)
If you need any financial metric for any listed stock – Charlie’s site or Finbox etc will have it.
Armed with spreadsheets of finance statements and predefined formulas – it’s helps us identify (filter) companies with strong returns on capital over very long periods of time
For example, here I’m talking about 5 to 10 years of proven performance (and not just the last 2-3 years)
We want to see consistent performance through good times and bad (ideally during a recession if possible)
From there, three basic questions intelligent investors should ask:
- Is the company consistently profitable at decent and stable profit margins, through good times and bad?
- Is this an asset-light (or capital intensive) business that has a high return on investment capital (ROIC)?
- Is the company continuously growing its revenue and earnings?
These are very simple questions to answer when you’re armed with the historical records of:
- a company’s balance sheet
- income statement and
- cash flow statements.
Again, I did this for Nvidia (as an example during the week). I shared some screenshots of my own personal spreadsheets (which draw from each of above over 10-years)
But here’s why I enjoy doing this exercise.
It’s not simply finding something to buy (i.e., looking up). What I am more excited about is ruling businesses out (i.e., looking down)
This is what I did with Nvidia – I was able to look down.
For example, I may look at “10” different company financial statements (over the past 10 years) in a weekend.
And that might take me between 5 to 10 hours or so. 99% of the time it will mean looking down (i.e. ruling all 10 out)
Guess what… that is a good result.
Here I have helped reduce my probabilities of being precisely wrong.
Knowing what to avoid is more important than finding winners.
Remember Charlie Mungers quote?
“It is remarkable how much long-term advantage people like us have gotten by trying to be consistently not stupid, instead of trying to be very intelligent.”
If you find a decent company (and I will show you how shortly) – things will work out in the end.
However, getting stuck with a poor quality company – or paying far too much for some “cash furnace” – and losing “50% on your investment” after a couple of years – is not fun.
Okay – let’s start with our first question of three – the importance of being consistently profitable.
Consistently Profitable w/Stable Solid Profit Margins
The legendary fund manager Peter Lynch had a motto: “earnings, earnings, earnings”
It’s earnings which drive stock prices over the long-term.
In the short-term, momentum trading will tend to distort this relationship (e.g., investor fear and greed) – however the impact is always temporary.
A company’s fundamentals drive prices in the long-run.
Warren Buffett would tell you that it’s “demonstrated consistent earning power” he looks to acquire.
If the company can consistently make money, its intrinsic value will steadily increase.
Shareholders are rewarded through the growth of the business, share buybacks, or dividends.
The value increase has a great impact on stock prices, too, because over a long period, price always follows value.
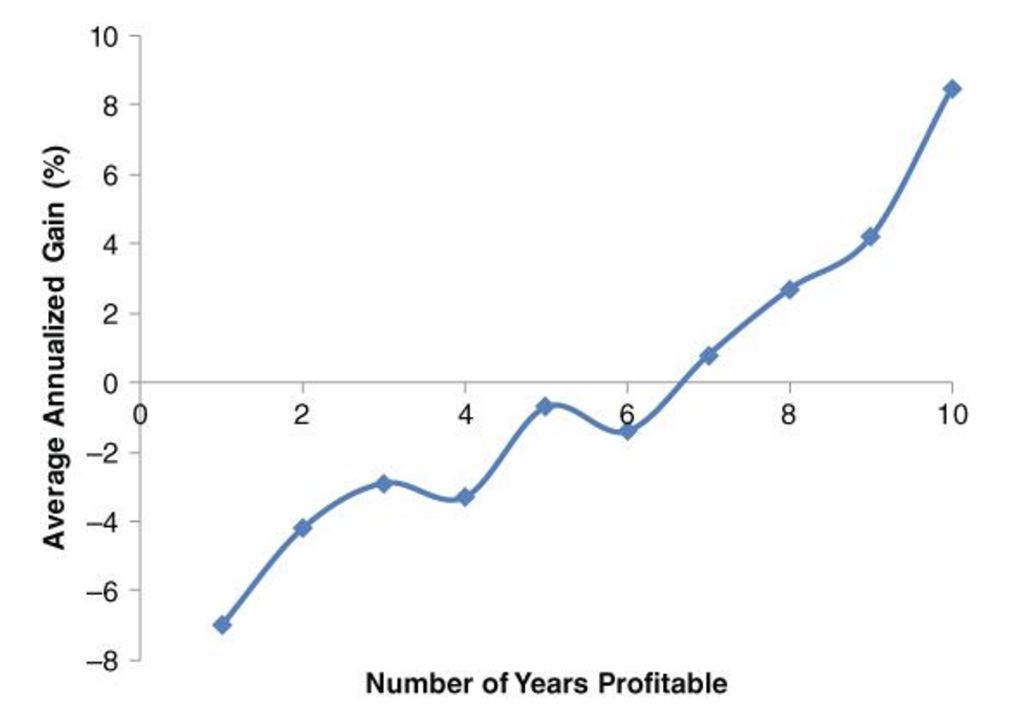
For example, statistics shows the companies who have enjoyed 10 straight years of profitability have averaged annual gains of ~8.5%
However, for those who average only 5 years, the average annualized gain is slightly negative.
Source: “Invest Like a Guru”
This chart is extremely helpful…
For example, if you only invested in consistently profitable companies over the long-term (and nothing else) – your probabilities of (long-term) success are far higher.
Again, we’re working our way towards being “approximately right”. According to Tian:
There have been 3,577 companies traded continuously over the past ten years (up until 2016). Among these 3,577 stocks, 1,045 or 29 percent were able to make money every year.
Collectively they averaged an annualized gain of 8.5 percent a year, doubling the gain of 4.2 percent generated by the second group, which were profitable in nine of the ten years.
For the companies that were profitable six or fewer years over the past ten, the average gain is negative, even if held for ten years. Overall, the companies that are in the S&P 500 list did better than the average.
Immediately you have an advantage!
You can stop reading now – just do this one rule – and most of you will enjoy better results than the average investor.
Still with me and want more? Maybe some Ginzu knives?
Of course you do….
Now, a consistently profitable company is just one razor we should apply.
For example, even if a company has always been profitable for 10 straight years – that doesn’t mean it will continue to be.
And this is where strong, consistent (above average) profit margins are helpful.
If a company can maintain a higher profit margin over the long term, it most likely has an economic moat that protects its pricing power from competition (another key Buffett criteria).
Now I said we would come back to Apple….
They are a great example… with best in class profit margins that most companies could only dream of.
Their competitive moat is almost unparalleled (apart from Nvidia)
A higher profit margin leaves room for the business to stay profitable during bad times, when a low and unstable profit-margin business may fall into loss, in turn crushing their performance.
So what’s consistently high profit margin you ask?
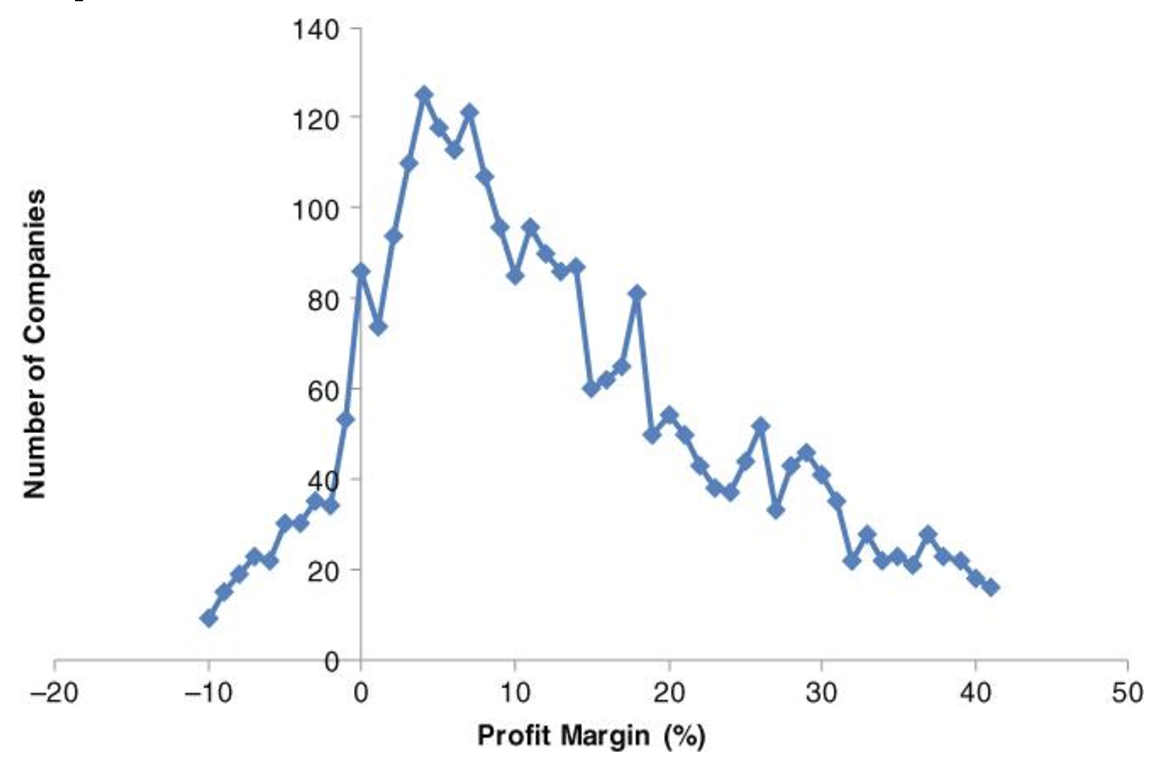
Tian offers us some useful historical data from over 3,500 companies listed in the US:
Source: “Invest Like a Guru”
Based on historical data – the median is 10%.
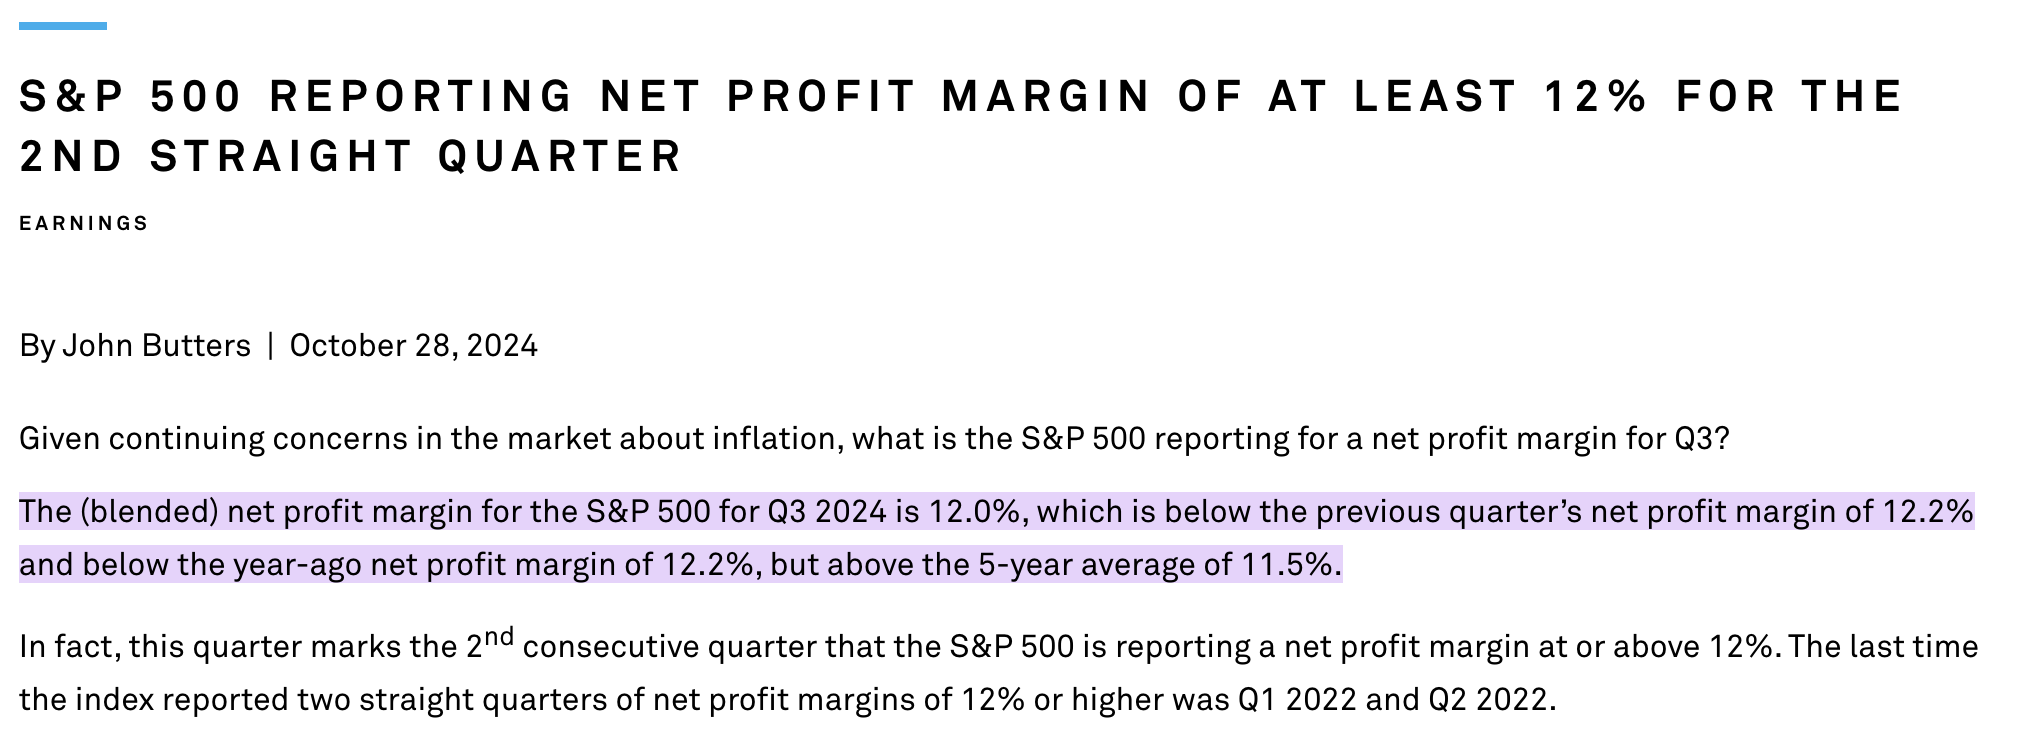
For this year (2024) — according to Factset — the average net profit margin has averaged 12% – which is close to a record for the Index.
Again, this is heavily skewed by the Mag 7 (being 35% of the total market weight – with the exception being Telsa).
Tian offers more historical data:
- ~29% of companies have an operating margin higher than 20 percent;
- ~16% of companies have an operating profit margin of 30% or higher; however
- ~12% of companies have been profitable and have a 10-year median operating margin higher than 20% over ten years
Let’s think about this….
If we set our investing guidelines by applying a requirement of consistent profitability with a 10-year operating margin of 20% – it’s reasonable assume that less than 12% of all listed companies would quality
This is great news – as our odds of success are sharply higher.
Now given the above – where do you think Warren Buffett is looking?
Let’s look at his Top 5 holdings – which amount to ~71% of this total portfolio.
As of Jan 4th 2024 – they are: (1) AAPL (26.2%); (2) AXP (15.4%); (3) BAC (11.8%); (4) KO (10.8%); and (5) CVX (6.7%)
For example, do you think Buffett is targeting:
- (a) 10-years of profitability?; and
- (b) strong operating profit margin (i.e., EBIT / Revenue)
| Company | Consecutive Yrs Profitable |
Avg 10-Yr Operating Profit % |
|---|---|---|
| Apple (AAPL) | 10 | 24.1% |
| American Express (AXP) | 10 | 24.4% |
| Bank of America (BAC) | 10 | 42.4% |
| Coca-Cola (KO) | 10 | 24.0% |
| Chevron (CVX) | 3 | 5.8% |
The first four are more than double the average of 12% operating profit (i.e., EBIT / Revenue) – with all 4 satisfying the 10-year consecutive profitability.
Chevron (CVX) is the outlier – which experienced losses during the crisis of 2000 and negative prices for oil.
However, post COVID through 2024 TTM (Trailing Twelve Months) – CVX has averaged a operating profit margin of 15.5% (well above the market average)
But it’s clear to me – the Oracle of Omaha is very much focused on top shelf companies.
Makes sense to me.
Strong Returns on Invested Capital
Whilst the ‘average’ amateur investor will likely focus on earnings (and widely cited metrics like PE ratios) – professional investors look towards returns on invested capital (ROIC)
Here it’s worth repeating my quote from Buffett:
“The best business to own is one that over an extended period can employ large amounts of incremental capital at very high rates of return. The worst business to own is one that must, or will, do the opposite-that is, consistently employ ever-greater amounts of capital at very low rates of return.”
There is nothing in here about “earnings per share”.
This is about return on capital.
Buffett’s learned some difficult realities of investing in capital-intensive businesses early in his career.
As a 35 year old – he purchased a broken textile mill (Berkshire Hathaway).
The stock was extremely cheap… but turned out to be your classic “value trap”
However, the lesson served him well for the rest of his investing career.
After he realized the textile mill was just soaking up a lot capital for little to no return – he compared that with his investment in See’s Candy
From his 1990 shareholder letter:
We’ve just passed a milestone: Twenty years ago, on January 3, 1972, Blue Chip Stamps (then an affiliate of Berkshire and later merged into it) bought control of See’s Candy Shops, a West Coast manufacturer and retailer of boxed chocolates.
The nominal price that the sellers were asking – calculated on the 100% ownership we ultimately attained – was $40 million. But the company had $10 million of excess cash, and therefore the true offering price was $30 million.
Charlie and I, not yet fully appreciative of the value of an economic franchise, looked at the company’s mere $7 million of tangible net worth and said $25 million was as high as we would go (and we meant it; i.e., almost 4x its book value).
Fortunately, the sellers accepted our offer.
See’s candy sales in the same period increased from $29 million to $196 million. Moreover, profits at See’s grew even faster than sales, from $4.2 million pre-tax in 1972 to $42.4 million last year.
For an increase in profits to be evaluated properly, it must be compared with the incremental capital investment required to produce it.
On this score, See’s has been astounding:
The company now operates comfortably with only $25 million of net worth, which means that our beginning base of $7 million has had to be supplemented by only $18 million of reinvested earnings.
Meanwhile, See’s remaining pre-tax profits of $410 million were distributed to Blue Chip/Berkshire during the 20 years for these companies to deploy (after payment of taxes) in whatever way made most sense.
In our See’s purchase, Charlie and I had one important insight:
We saw that the business had untapped pricing power. Otherwise, we were lucky twice over. First, the transaction was not derailed by our dumb insistence on a $25 million price. Second, we found Chuck Huggins, then See’s executive vice president, whom we instantly put in charge. Both our business and personal experiences with Chuck have been outstanding. One example: When the purchase was made, we shook hands with Chuck on a compensation arrangement – conceived in about five minutes and never reduced to a written contract-that remains unchanged to this day!
Buffett has since said that “all earnings are not created equal.”
If an asset-heavy business wants to double its revenue, whether because of inflation or real growth, it has to double the amount of capital tied to inventories and tangible assets.
That’s not a great business.
The business has to generate at least the same amount of market value for the amount it reinvested to make it meaningful, which is not often easy to do.
On the other hand, an asset-light business is required to invest less and is positioned to deliver higher real returns to shareholders (note: technology tends to be very asset light business)
An asset-light business can therefore generate higher return on invested capital (ROIC) and higher returns on shareholders’ equity (ROE).
Because of the light requirement on capital, the company usually employs little debt, unless the management is too aggressive in borrowing to fund growth and acquisitions.
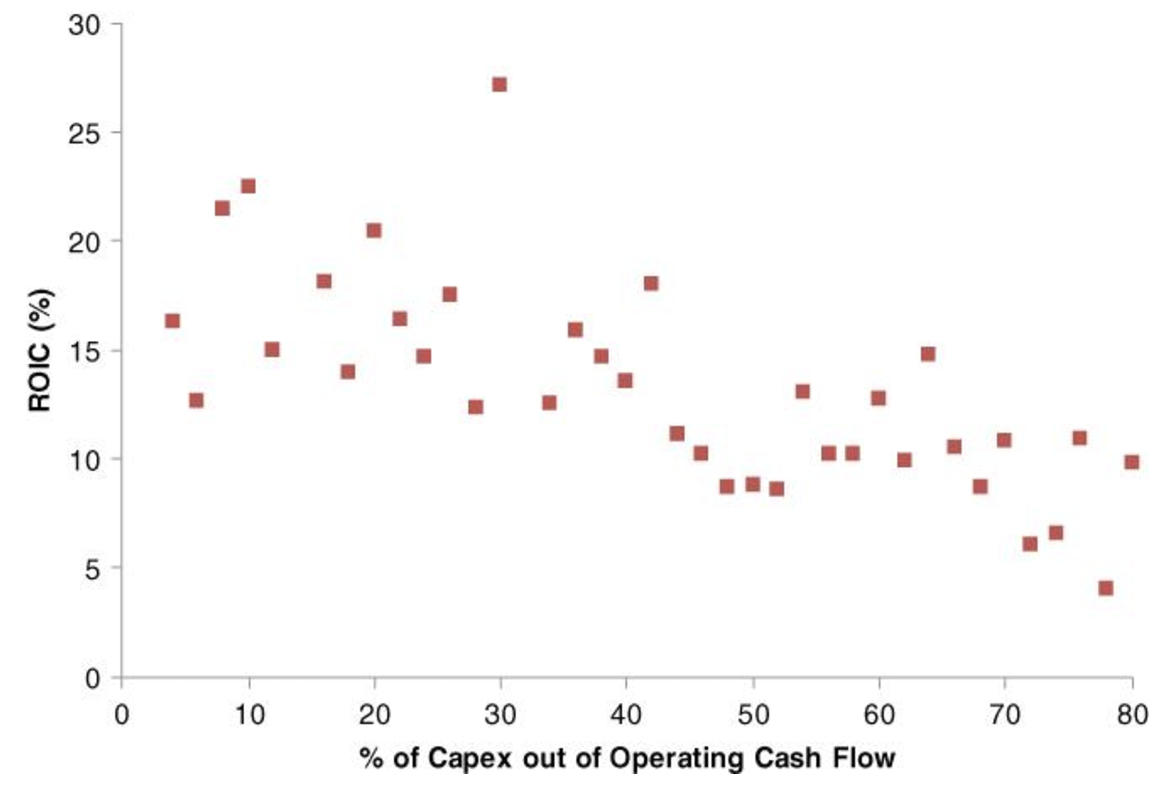
This can be ascertained from the correlation between the average return on invested capital and the percentage of capital expenditure out of the operating cash flow.
The chart below compares ROIC (Y-Axis) with % of Capex from Operating Cash Flow (X-Axis) for the 3,577 listed US companies.
Source: “Invest Like a Guru”
I love this chart…
Here we find very high ROIC corresponds with generally lower levels of capex from operating cash flow.
The relationship between the average 10-year median ROIC and the percentage of capex out of operating cash flow
The trend is clear:
When a company needs to spend less money out of its operating cash flow, the average return on invested capital is higher.
Here’s the kicker….
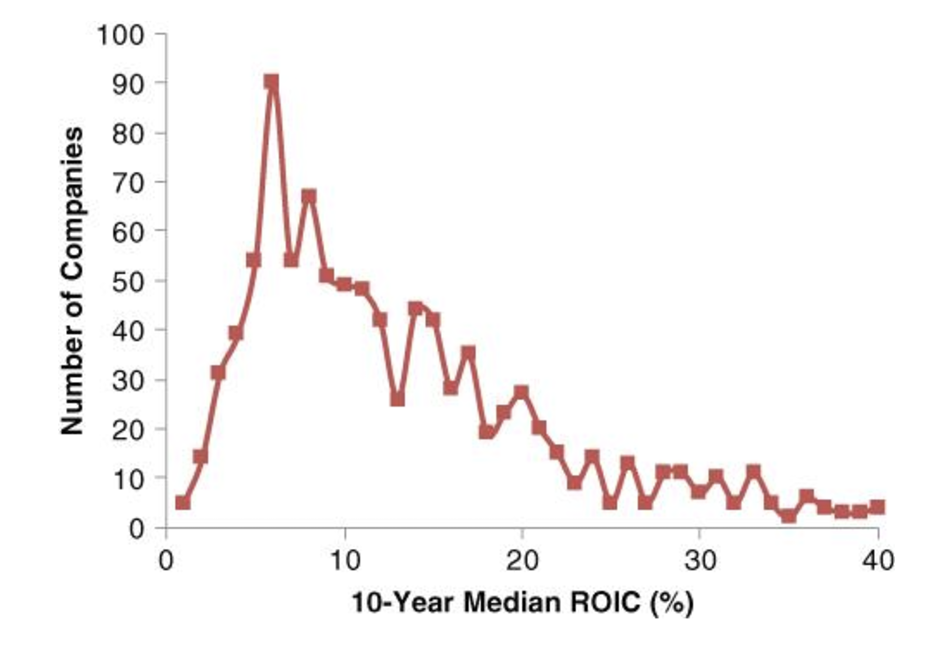
Very few companies have achieved ROIC of 20%+ over 10 years – even among companies that are consistently profitable.
The following chart shows the distribution of the median ROIC over the past ten years for the 1,045 companies that were profitable every single year
Source: “Invest Like a Guru”
The majority of companies have the 10-year median ROIC of ~14%
90% of all companies average only ~6%.
When you consider the weighted average cost of capital (WACC) for most companies is ~6% to 8% (typically closer to 8%) – it means returns on incremental capital are not high.
The takeaway for investors:
If you are able to identify companies who consistently achieve ROIC of 20%+ – they are rare gems. Again, measure this over 10-years (not just a couple of years)
Now less than 1 in 5 of 1,045 US listed companies that were profitable every single year for 10 achieved ROICs over 20%.
But for those that did – their performance was stellar:

Source: “Invest Like a Guru”
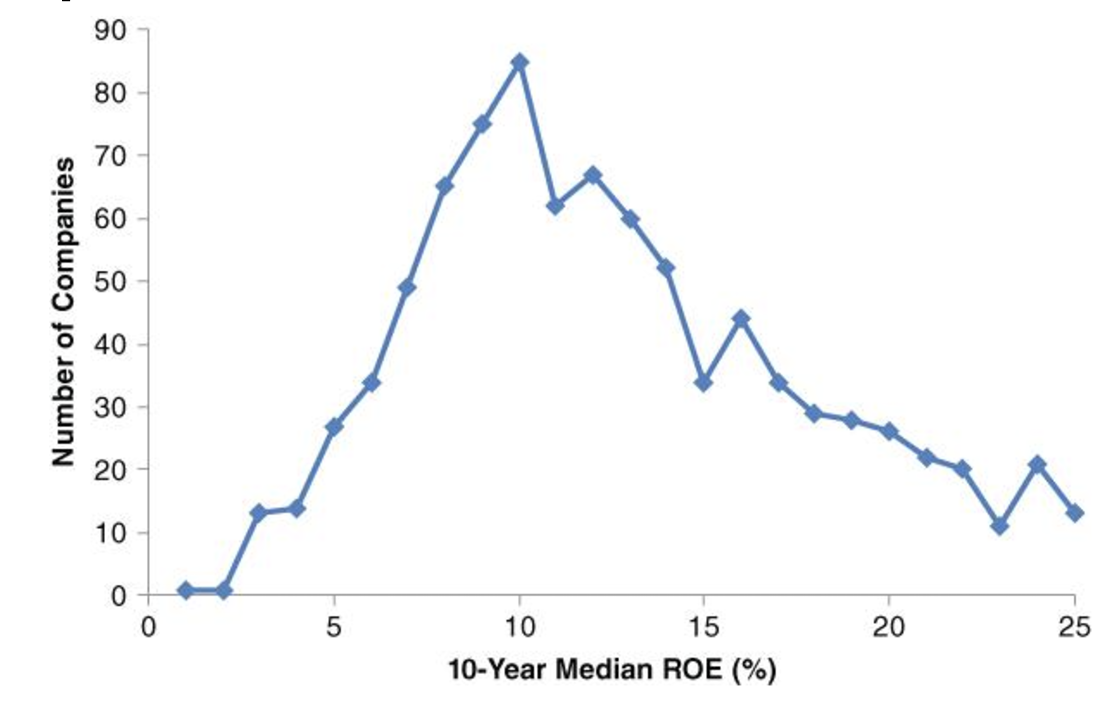
In short, companies who can average consistently high ROIC typically tend to post superior gains (i.e. north of 11% per year)/ Tian also cites a business’ return on equity (ROE).
Source: “Invest Like a Guru”
This will often mirror the trend we find with ROIC.
Tian adds that very few companies can achieve long-term average ROE of more than 15%.
Let’s revisit the same Top 5 stocks in Buffett’s portfolio and their respective 10-year average ROICs and ROE’s
| Company | 10-Yr Avg ROIC % | 10-Yr Avg ROE % |
|---|---|---|
| Apple (AAPL) | 39.1% | 85.9% |
| American Express (AXP) | 11.3% | 17.3% |
| Bank of America (BAC) | 10.7% | 8.1% |
| Coca-Cola (KO) | 11.8% | 31.4% |
| Chevron (CVX) | 4.2% | 6.5% |
It’s little wonder Bufffett has said in recent shareholder meetings that “Apple is one of the best businesses he’s ever seen”
The numbers are unparalleled over this time period.
And who knows – maybe Nvidia in another 10 years time will be similar (but I doubt it)
Now when you see these numbers (operating profit margins / return on equity / return on invested capital) — you can see why Apple was more than 50% of this total portfolio from 2016 until this year (when he sold 2/3rds of his position)
Not only does Apple operate with avg operating profit margins of 24.1% (over a 10-year period) – the iPhone marker delivered a 39.1% avg ROIC; and 85.9% avg ROE.
AXP and KO are also very high performing (consistent) assets.
CVX however is a very capital intensive business – and given the cyclicality – its ROIC is only 4.2% over 10 years.
For what it’s worth, it’s past two years CVX has averaged 17.7% ROIC (and hence the acceleration in the share price).
On the importance of these metrics – Buffett discussed this in his 1987 shareholder letter.
In its 1988 Investor’s Guide issue, Fortune reported that among the 500 largest industrial companies and 500 largest service companies, only six had averaged a return on equity of over 30% during the previous decade.
The best performer among the 1000 was Commerce Clearing House at 40.2%
The Fortune study found that only 25 of the 1,000 largest companies achieved an average return on equity of over 20 percent in the ten years from 1977 through 1986, and no year worse than 15 percent.
“These business superstars were also stock market superstars: During the decade, 24 of the 25 outperformed the S&P 500.”
If value goes up, sooner or later price follows. Some things never change, like the laws of physics”
Buffett has called the importance of value an “immutable law” of the market (such as thermodynamics, gravity and inertia)
Now just for clarity – we are only talking about quality.
We are not talking about valuations.
For example, it was valuation which saw Buffett sell 2/3rds of his Apple stake – not the quality of the business.
He would have been at pains to sell this business (as I was at $254 per share)
Yes, even Buffett has a price for a super high quality stock.
Sell when others are greedy; buy when they are fearful.
And I said the other day when estimating an intrinsic value for Nvidia using a DCF – we’re always trying to do two things:
- Estimate the earnings potential of companies for years into the future; and second
- Buy these companies at a very attractive prices (in the event things don’t go to plan)
It’s the second part of the equation which most investors get wrong.
They know what to buy – they just pay too much
Put another way – they spend far too much time looking up (e.g. how much it could grow or make) – when they need spend more time looking down (i.e., what could I potentially lose)
Growing Revenue and Earnings
Growth is an essential element of any good business.
If a company can steadily grow its revenue and earnings over the long term while maintaining its profit margin, the company is in an advantageous competitive position within its industry.
But I want to emphasize the latter part of this sentence; i.e., maintaining its profit margin.
Far too many companies report a growth in earnings (or revenue) at high rates – however the incremental capital invested to achieve that growth often comes at a reduced margin.
That’s value destruction.
How many reports do you read from “analysts” who only look about revenue growth or earnings growth – without any mention of ROIC or the effectiveness of incremental capital?
On the other hand is a business that grows faster than its fixed costs.
These companies will see profit margins expand over time (not unlike what we have seen with tech the past few years; i.e.. asset-light and low-capital-requirement businesses)
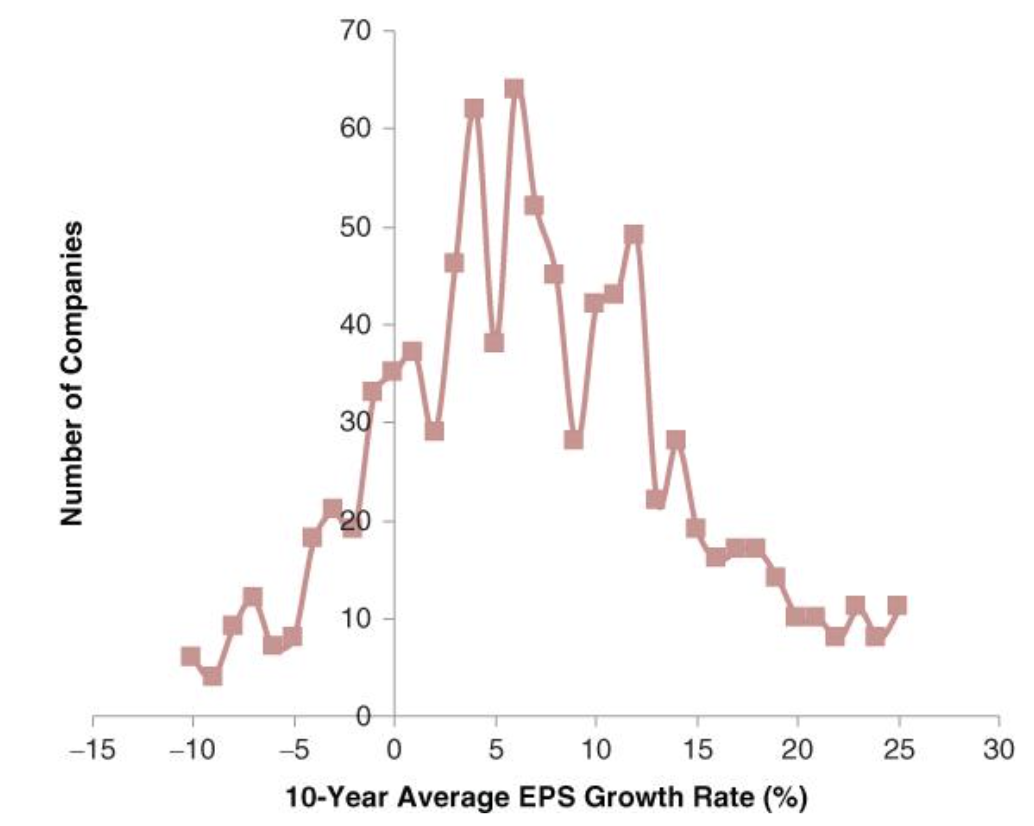
Tian offers the 10-year average earnings-per-share (EPS) growth rate distribution of the 1,045 companies that were profitable through all of the past ten years through 2016.
Source: “Invest Like a Guru”
We can see that the ten-year average EPS growth rate peaks at about 7 percent a year.
Now just pause on that 7% figure for a moment….
The long-term (100 year) average capital gain for the S&P 500 is about 8% (plus dividends)
Put another way – the gain in prices is typically a function of the gain in earnings (over time)
Occasionally there will be years where they are higher or lower – but the mean is around 7%
Based on this chart – we see that the majority of the companies grew their earnings at less than 10% a year.
Tian adds among those 1,045 companies, more than 13% had negative EPS growth over the past ten years, although they have always been profitable.
Only about 15% of companies can grow faster than 15% a year
Now it doesn’t take a rocket scientist to know that a faster-growing company can grow its business value faster than a company that is growing slowly.
All things being equal – this will be reflected in the stock price.
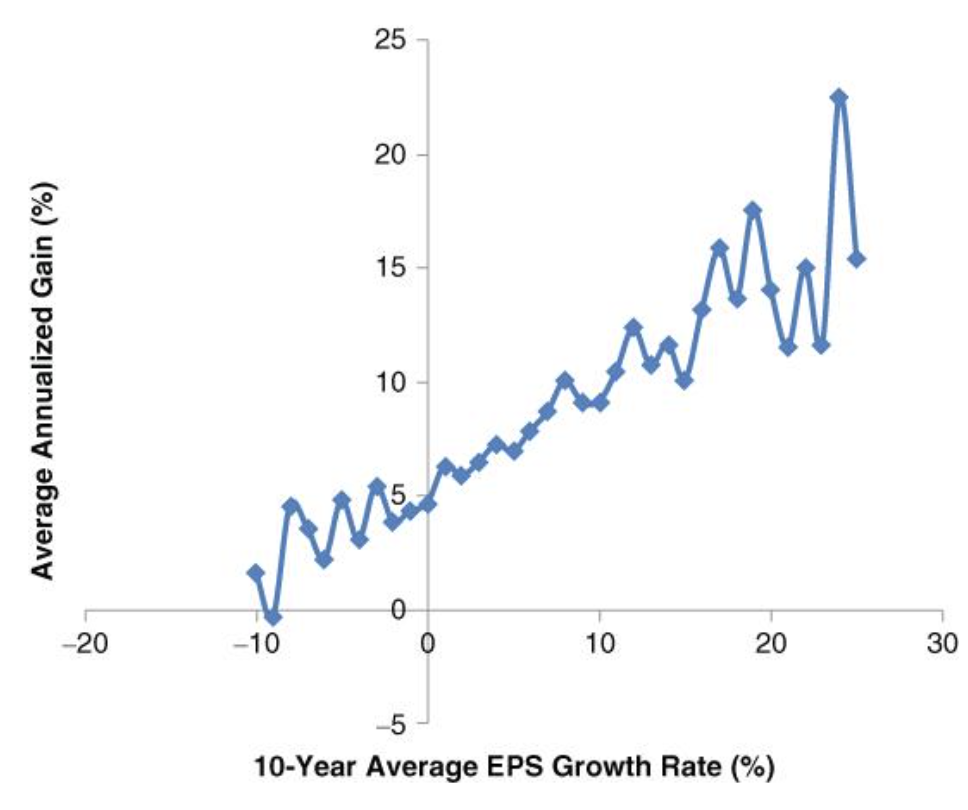
Below Tian offers the correlation between the 10-year average gains of the stock and the 10-year average EPS growth rate for the 1,045 consistently profitable companies
Source: “Invest Like a Guru”
There is a positive correlation between the rate of EPS growth and the stock performance of the companies.
Those that were profitable over the past ten years but had declining EPS did the worst.
This is another razor we can add to our filter.
I told you I would throw in the Ginzu knives!
Tian adds that the stock of the companies that grew 20% a year outperformed those that grew 5% a year by more than 6% on average.
The advantage in investing in faster-growing companies is significant (just ask NVDA shareholders!)
As a group, the faster-growing companies represent a better place to look for better-performing stocks (on the basis they are consistently profitable over a long period)
Again, fast growing cash furnaces is another discussion (and perhaps a different blog!)
Putting it All Together…
I could continue to write a lot more on the subject of quality…
However, by answering the three basic questions puts you in a very strong position (statistically).
From there, it’s about paying a reasonable price (i.e., estimating its intrinsic value)
Yogi Berra once said, “It’s tough to make predictions, especially about the future.”
Sure!
What do we have? Probabilities. That’s it.
None of us know tomorrow will bring (but plenty think they do) – however analyzing past behavior can help us make better decisions.
For example, the data shows us that a company that did well consistently in the past is much more likely to do well in the future than those that didn’t previously do well.
It’s not a guarantee – however it’s a better bet.
That said, businesses are constantly evolving. For example, honey pots that produce incredible net margins (or growth rates) will attract competitors.
From there, margins are reduced. Competition is a wonderful thing.
In 1978 Buffett wrote the following:
Experience, however, indicates that the best business returns are usually achieved by companies that are doing something quite similar today to what they were doing five or ten years ago.
That is no argument for managerial complacency. Businesses always have opportunities to improve service, product lines, manufacturing techniques, and the like, and obviously these opportunities should be seized.
But a business that constantly encounters major change also encounters many chances for major error.
Furthermore, economic terrain that is forever shifting violently is ground on which it is difficult to build a fortress-like business franchise. Such a franchise is usually the key to sustained high returns.
If a company continues to produce a similar product, it has the opportunity to continuously improve efficiency, gain more experience, and get better at doing so than everyone else.
It also has the time to build the brand, trust and recognition – which cultivate user behavior.
Look at the devices (and services) you use today… how likely are you to swap tomorrow?
Over time, the company can build an economic moat that is hard for others to replicate and maintain its high returns.
And addictive user habits give the companies tremendous pricing power (just ask Meta, Google, Amazon and Apple!)
I will leave our discussion on quality here for now – but there will be more to follow in subsequent weeks.
There’s a lot more I want to cover on this subject (with examples).
With interest rates likely to rise – quality will become more important than ever.
To that end, this is why I think 2025 will be about stock selection.
Outperformance will come from selecting stocks of the highest quality and at attractive prices.
This year many investors “ran the tables” and got away with paying “any price”. And occasionally that will happen (2007, 1999 are good examples).
I remember thinking I was reasonably clever between 1996 and 1999… as my portfolio continued to show outstanding returns year after year (well above 20%).
It was shooting fish in a barrel. Everything (in tech) went up. But that’s the thing – a rising tide lifts all boats – even a very leaky boat like mine. However, when that tide sank… game over.
Using the razors I’ve shared – this will help you avoid getting things precisely wrong in the years ahead.
More to come…

